
Role
Graphics Supervisor
Services
Visual Journalism
Mapping Breaking News
Across tragedies, conflict, and breaking crime, the challenge is always the same: give the viewer the essential spatial story before they’ve had time to read anything. This is how I think about maps, and how I built a system so the whole team thinks the same way.
Output
Maps + updated style guide
THE DECISION
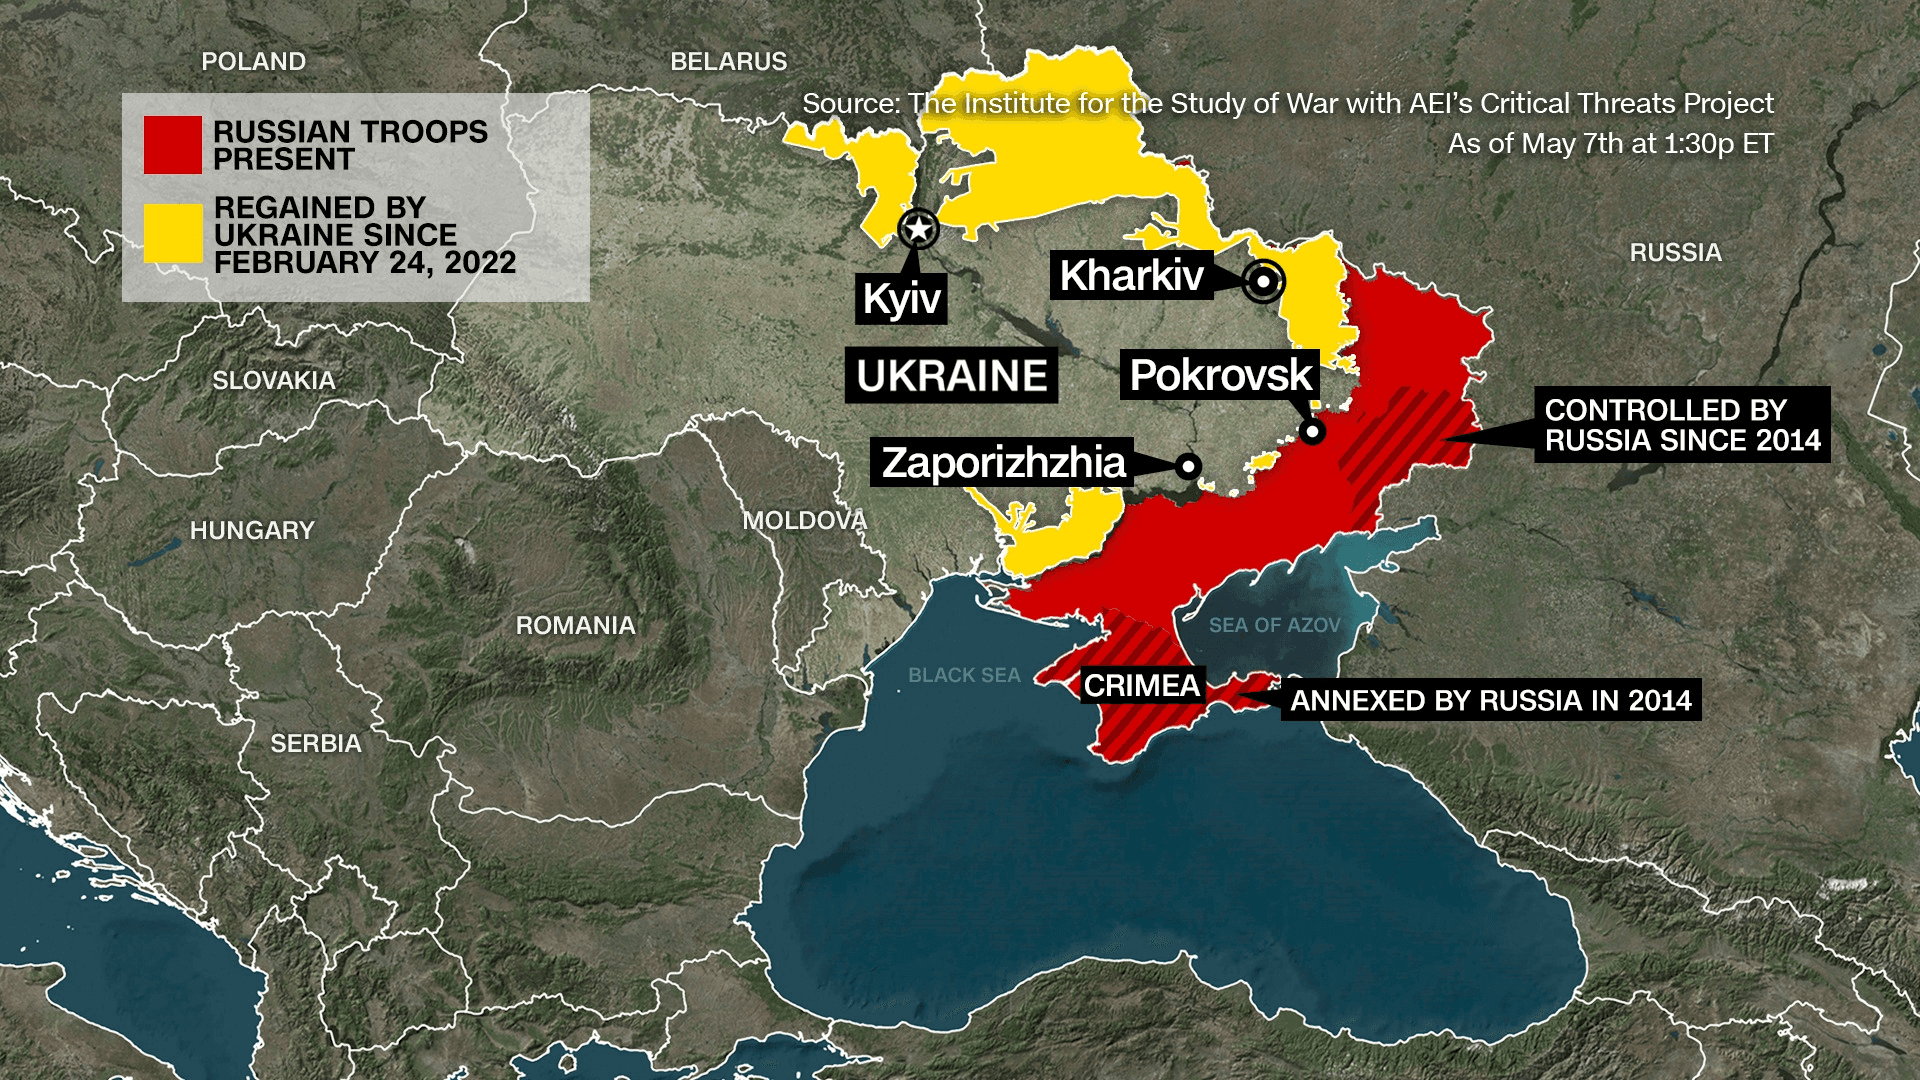
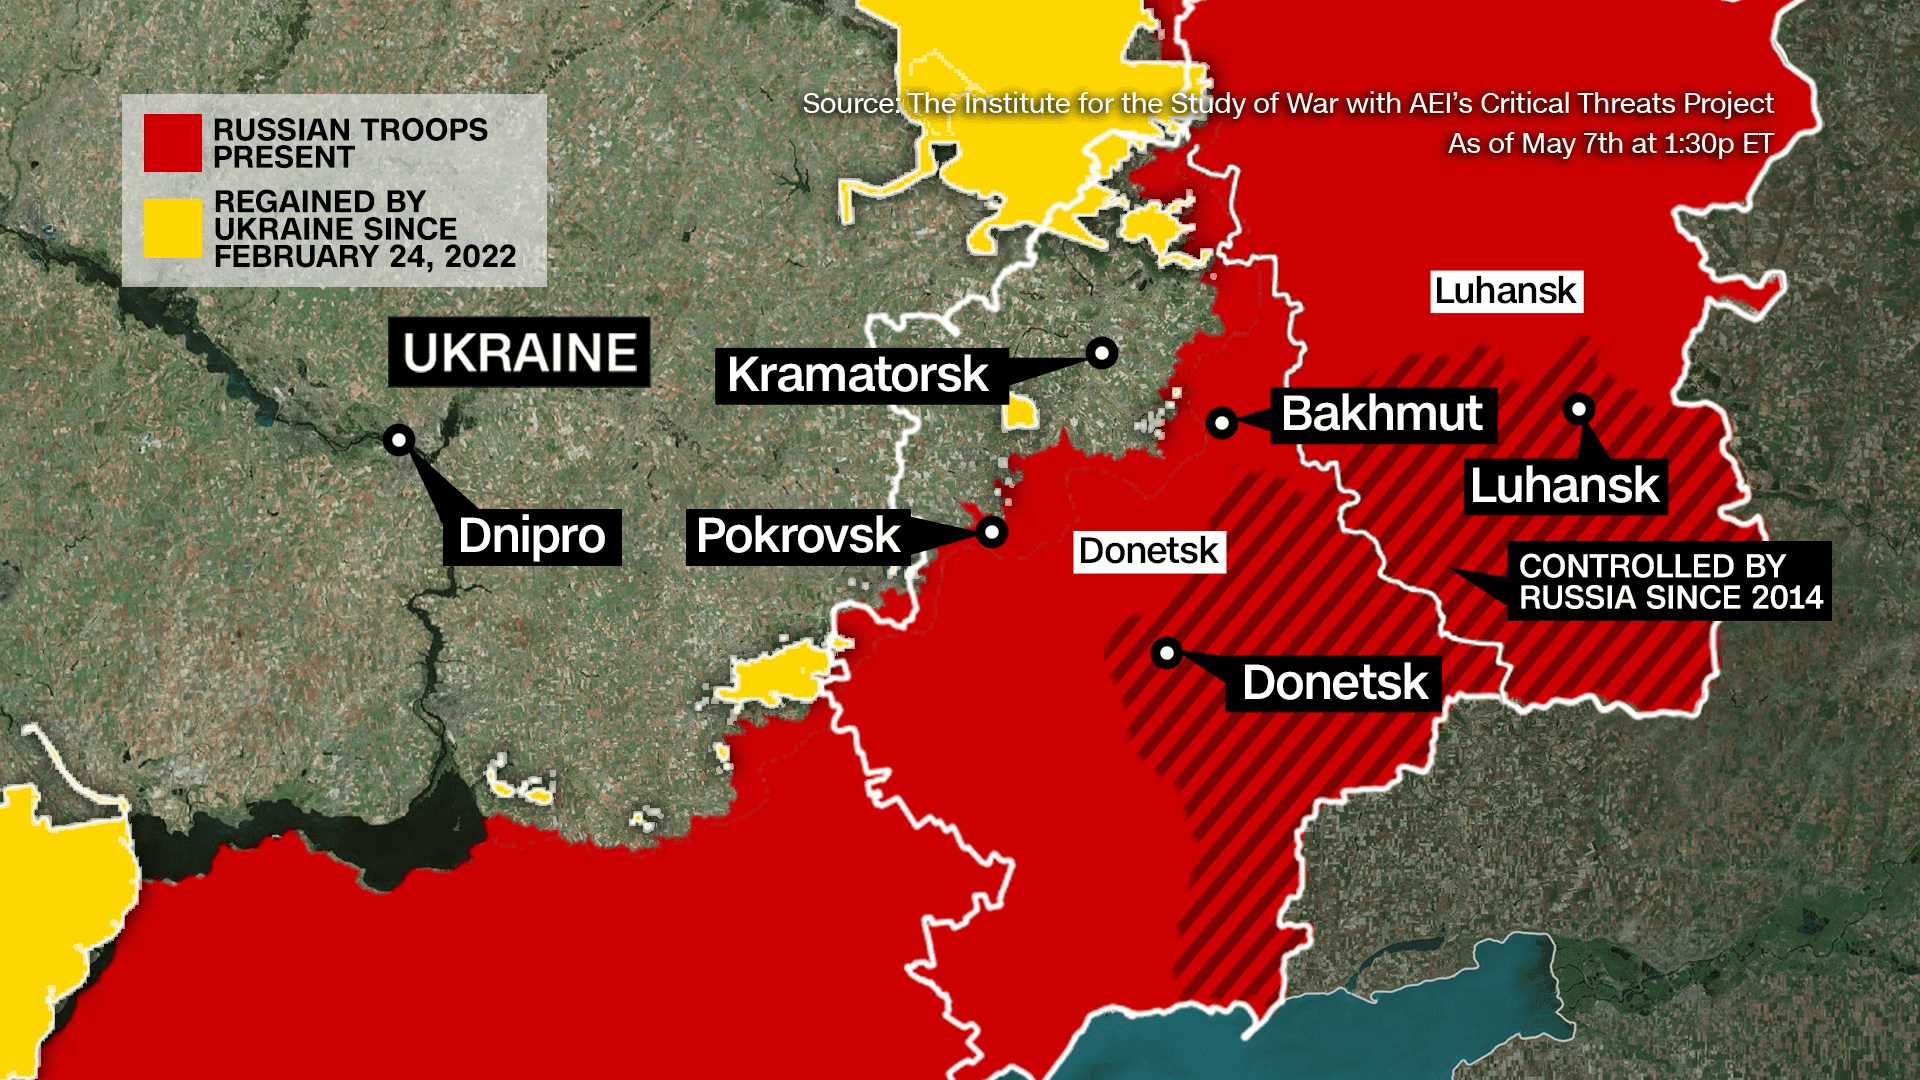
We built four regional maps: Donetsk, Zaporizhzhia, Kherson, and Kharkiv. Each is updated daily, alongside the national overview. The regional maps let viewers track the specific territory shifts that the headline referred to, while the national map kept the conflict in geographic context. Updated every day without rebuilding from scratch.
THE DECISION
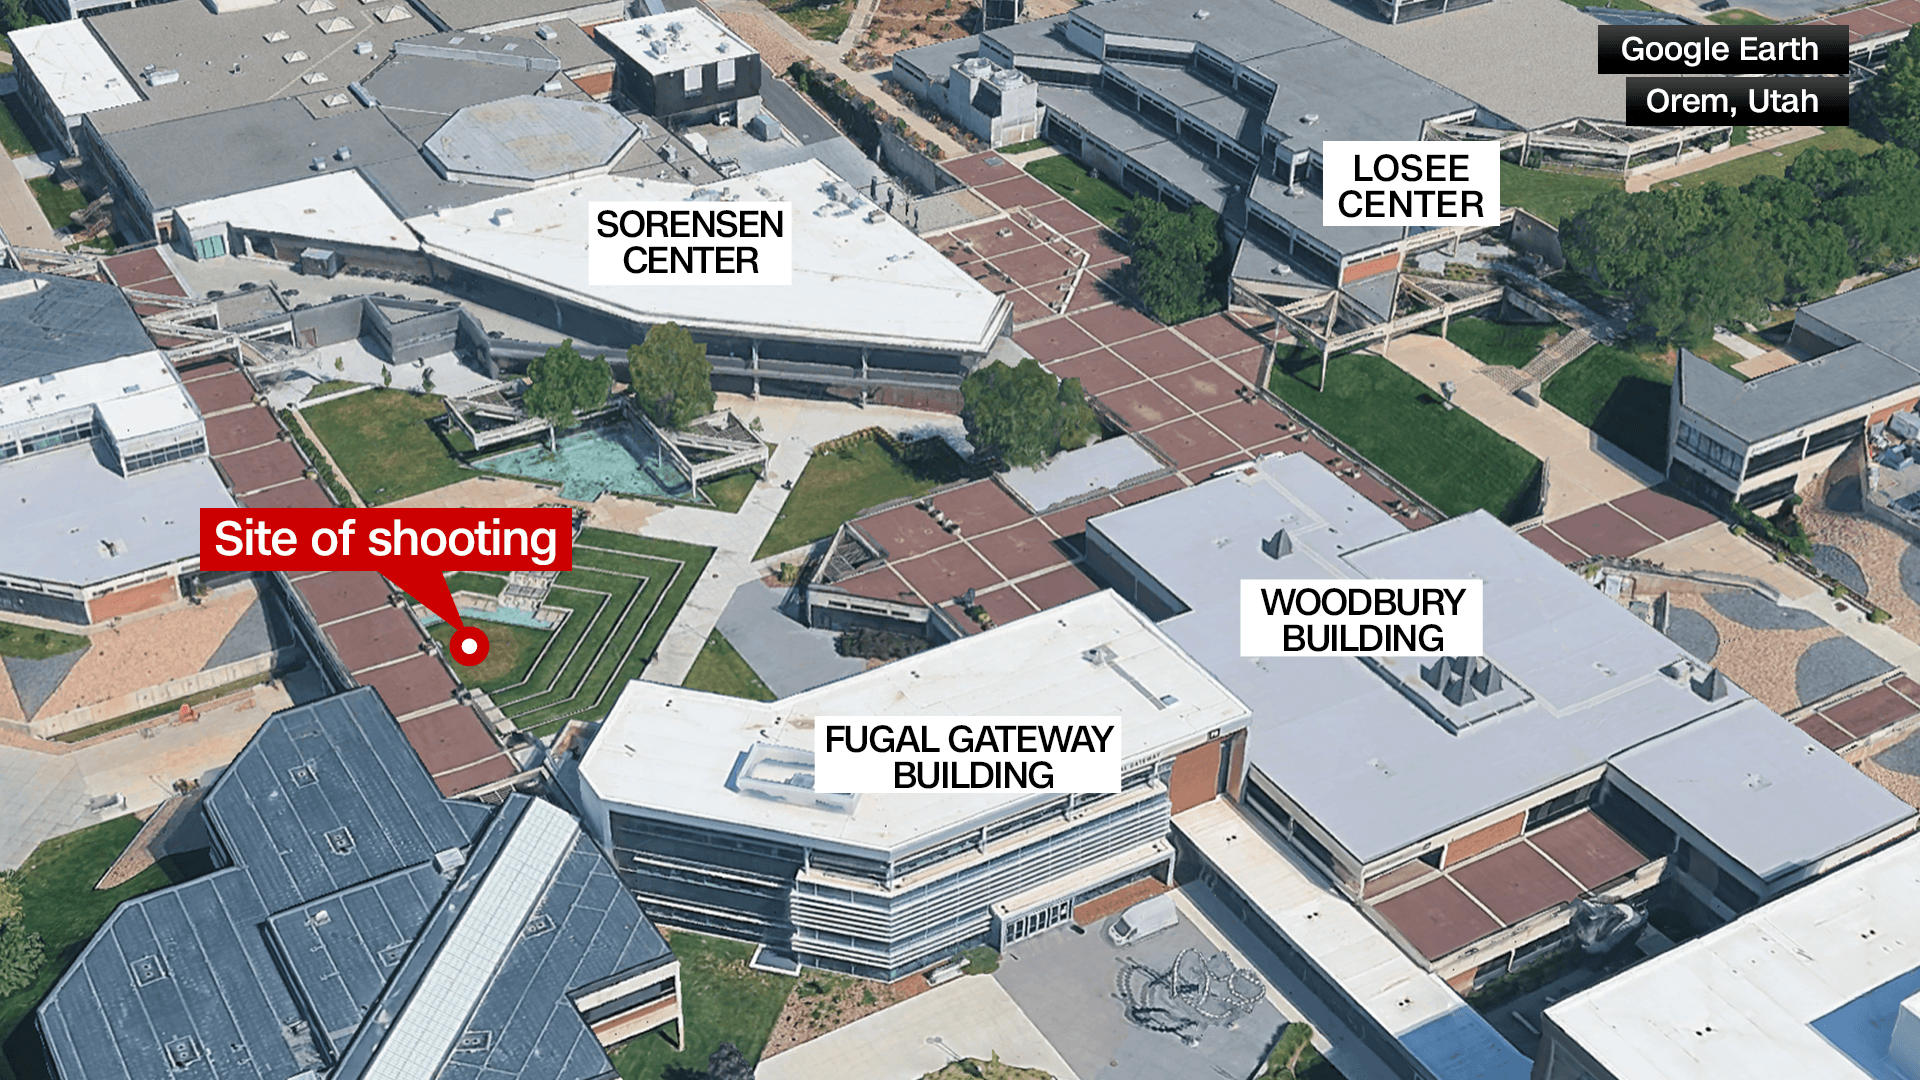
For this story, two parallel threads were unfolding: the shooting itself and the subsequent manhunt. This meant the maps needed to work at two different scales: a zoomed-in view of the university campus where the shooting occurred, and a zoomed-out view of Utah tracking the manhunt across the state.
THE DECISION
General location was the story before anything else was known. I centered the map on DCA, labeled Runway 33, and kept the graphic intentionally generic until more details were confirmed. The following day, once aircraft types, flight paths, and the crash location were verified, I expanded the maps with fuller detail and context. These maps were later made into animations for deeper storytelling.
Before — the problems
-Inconsistent label styles artist to artist
-Outdated visual language
-No standard for sourcing or timestamps
-Color use varied with no editorial rationale
-Too much information, no hierarchy
POTOMAC RIVER CRASH, 2025
With only one confirmed fact: a crash near DCA’s Runway 33. I built a map to provide immediate geographic context during the late evening breaking coverage. The challenge was making this map with no editorial context, as the story had just broke


After — what the guide established
-Standardized label hierarchy and scale
-Color system tied to editorial meaning
-Date and source on all developing maps
-Visual language matched editorial language
-Consistency across shows for network-wide use
CHARLIE KIRK ASSASSINATION AND MANHUNT
This started as a location map highlighting where the shooting happened. As the story developed and more details emerged about the scene, the weapon, and the suspect’s movements, the map had to evolve into a sequence. The spatial story became a narrative.
UKRAINE WAR - TERRITORY MAPS
Ukraine’s frontline spans hundreds of miles across multiple regions. A single national map showed the overall picture but lost the detail viewers needed to understand what was actually changing day to day. One frame couldn’t do both jobs.
What this became — the style guide update






NEXT PROJECT
NEXT PROJECT